
(download is at the bottom)
UPDATED to v1.3.0 (18th Jan ’25)
Passband History is a helper app that can be used along side WSTX-X / JTDX to display passband activity of many of the JT/FT modes. Have you ever wondered where you should place your transmit ‘slice’?
Passband History helps with that by keeping up to 5 minutes worth of signals, displaying them ordered by SNR, and working out where best to place that transmission. It does this by :
- Looking for areas of low signal to noise ratio
- Working out if a contiguous area is large enough to fit a required percentage of our transmission ‘slice’ bandwidth
- Weight that contiguous area according to the distance from the red marker
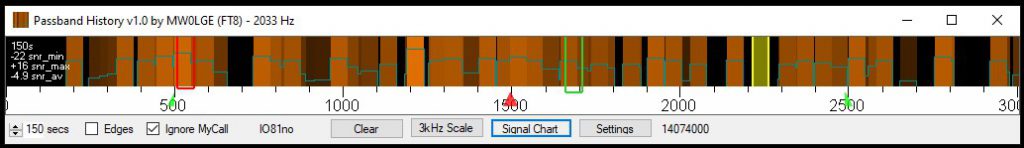
In the image above you can see the yellow area it is chosen. You can move your TX slice in WSJT-X / JTDX to be over the top of this yellow area. Unfortunately the protocol between WSJT-X / JTDX does not provide a method to set this TX frequency directly. Right click as normal in WSJT-X / JTDX to move the transmit slice.
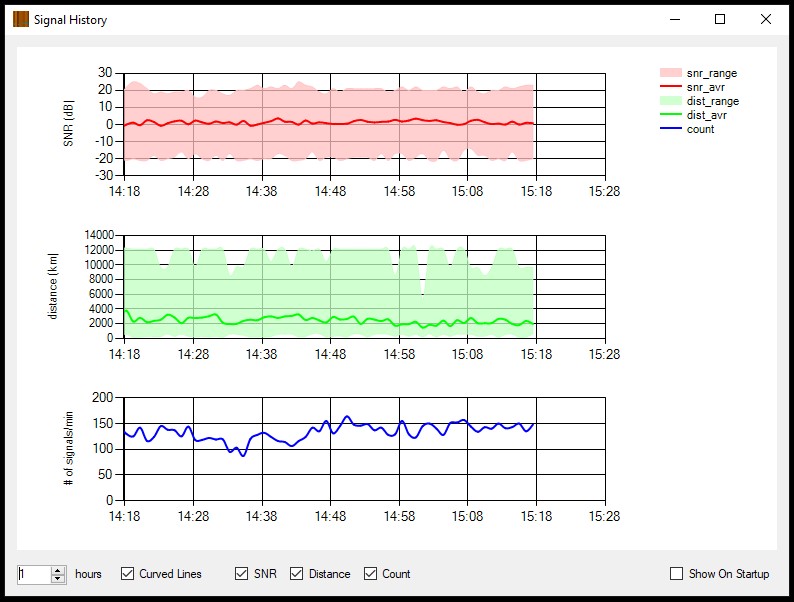
Pasband History also takes 1 minute snap shots of the signals received, and uses this information to produce three charts. An snr chart and a distance chart which both show minimum, maximum and averages. Distances are calculated using maidenhead locator information. The last chart shows the number of signals received in that 1 minute time slice. This data is not stored and will cover 48hrs of history.
The following video explains how to use the software and the download link is below.
v1.0.0 – release
v1.1.0 – fix to maidenhead parsing, more are now valid
v1.3.0 – updated and released via GitHub